Using the Page Hits Report to Analyze Your Site Traffic
Analyze your website traffic by pulling reports of page visits and hits by day, week, month, or a custom date range. Learn how many are visiting, how long they stay, and how they found your website.
A visit is tallied each time a unique visitor accesses a page of your website. View estimates of the time visitors spent on your site and see the ratio of visitors who access your pages directly to those who get website info from RSS feeds, widgets or calendar features. The Page Hits Report also allows you to learn what sort of equipment and software your viewers are using by showing page hits by platform and browser.
We recommend you use the web statistics offered in our reports to identify trends over time and then use that data to inform your strategy. It is less meaningful to review the statistics daily or in isolation from other statistics.
Changing Date Ranges
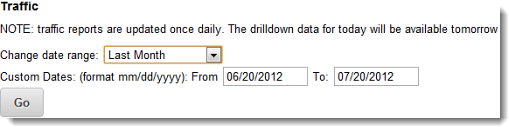
The Page Hits Report shows the previous month’s hits by default, but the date range can be changed. Preset ranges include Last Month, Last Two Months and Last Three Months. Choose the Custom option to change the range to any dates you wish. To change the report’s date range:
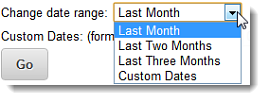
- To choose a preset option, click the Change Date Range menu, and choose a preset range.
- To select a custom date range, click the Change Date Range menu and choose Custom Dates.
- In the Custom Dates fields, enter the desired From and To range, using a mm/dd/yyyy date format.
- Click Go to load the date range’s data.
Viewing Page Hit/Page View Data
The area graph displays both Visits and Hits for the selected date range. The smaller area, shaded green, represents unique Daily Visits to the site. The larger area, shaded blue, represents Daily Page Hits, or how many pages were accessed during the day. A single visitor may view multiple pages on your site. Additionally, a visitor may be a web-crawling program, such as a search engine robot, that is reviewing the site to provide up to date data.
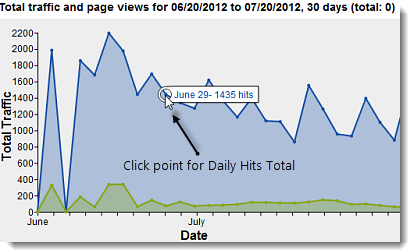
Daily statistics can be displayed by hovering on the graph’s outline at a point that corresponds to a day. Hover on the blue area for Hits totals and hover on the green area for Views totals.
Viewing Page Hit and Visit Details
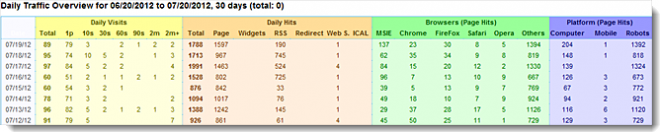
The table at the bottom of the screen displays a totals breakdown by 4 different measures: Daily Visits, Daily Hits, Browsers (Page Hits) and Platform (Page Hits). An explanation of each measure follows below.
Daily Visits
Shows the total number of visitors. Visits are broken down by estimated visit length.
- Total – The associated day’s total unique visitors.
- 1p – Number of visits where visitors viewed only one page or bounced to another site.
- 10s – Number of visits lasting less than 10 seconds.
- 30s – Number of visits lasting less than 30 seconds, but more than 10 seconds.
- 60s – Number of visits lasting less than 60 seconds, but more than 30 seconds.
- 90s – Number of visits lasting less than 90 seconds, but more than 60 seconds.
- 2m – Number of visits lasting less than 2 minutes, bur more than 90 seconds.
- 2m+ - Number of visits lasting greater than 2 minutes.
Daily Page Hits
View total daily page hits, broken down by the component specifically called for on the server. These hits are recorded by the LVSYS server and are true and accurate hit counts for the web component listed.
- Total – The associated day’s total gross traffic. This total includes page hits, widget calls, and calls to the other web components listed in the column.
- Page – Total Daily Page Hits. These are true hits to pages recorded by the LVSYS server.
- Widgets – Traffic to your site from widget calls, such as event postings.
- RSS –Total RSS feed calls for the day.
- Redirect – Total Business Directory Redirect calls for the day. Visitors clicking on a directory listing are routed through LVSYS servers before going to the business website, allowing LVSS to record the hit.
- Web S – Records total Web Services calls, such as web carts, stories pushed to the CMS, and server based email, among other services.
- ICAL – Measures calendar synchronizations per day.
Page Hits by Browsers
Shows an actual tally of the browsers used by visitors. The numbers in this section are derived by breaking down the Total Daily Page Hits (above) to present the browsers actually used.
- MSIE – Number of visitors using Internet Explorer.
- Chrome – Number of visitors using Chrome.
- Firefox – Number of visitors using Firefox.
- Safari - Number of visitors using Safari.
- Opera - Number of visitors using Opera.
- Other – Number of visitors using other browsers or web crawling robots (which do not use a browser).
Page Hits by Platform
Page hits by platform shows an actual tally of the platform used by visitors. View the ratio of visitors who are using computers or mobile devices to visit your site.
- Computer – Number of visitors using a computer.
- Mobile – Number of visitors using a mobile device. See important notice below.
- Robots – Number of visitors that are robots.
We strongly recommend you consider implementing a mobile template if mobile traffic comprises 10% or more of total traffic. Your visitors will appreciate the enhanced and reliable usability of a mobile platform template.